
We shipped V5.0 today. It is the largest release we have ever done, and I want to explain what we actually built and why — not the marketing version, the real one. Fair warning: this is long. I think the details matter.
Here is what this post covers: the problem we set out to solve, how Nova — our Intelligence Agent — works, the Decision Intelligence Equation that governs how Nova thinks, and why I believe this is a fundamentally new way to make business decisions. If you only have five minutes, skip to "How Nova Actually Thinks" — that is the core of everything.
The problem, stated plainly
Here is something I have watched happen dozens of times. A CEO asks a question — "why did margins compress in Q4?" — and what follows is a genuinely bizarre sequence of events. An analyst opens a dashboard. The dashboard doesn't have the right view. The analyst writes some SQL. The SQL returns numbers. The numbers go into a slide. The slide goes into a meeting. In the meeting, someone asks a follow-up question that the slide doesn't answer. The analyst goes back to the SQL.
The whole loop takes days. Sometimes weeks. And at the end of it, the CEO still makes the decision on gut feel because the analysis arrived too late, or answered the wrong question, or was missing the one piece of context that actually mattered.
I've seen this at Fortune 500 companies with 200-person analytics teams. I've seen it at startups where the founder is the analytics team. I've seen it at consulting firms whose entire business is supposedly making this process better. The tools got faster, the dashboards got prettier, but the gap between "we have data" and "we made a good decision" stayed roughly the same.
If you have ever sat in a boardroom and watched a $50M decision get made because someone had a "feeling" — while a perfectly good dataset sat untouched on a server somewhere — you know exactly what I am talking about. That moment is the reason KNOWIDEA exists.
We started with a simple thesis: that gap is not a tooling problem. It is a reasoning problem. You do not solve a reasoning problem with better charts. You solve it with a system that actually reasons.
V5.0 is the full realization of that thesis. Let me walk through it.
Nova: The Intelligence Agent
You open KNOWIDEA. You type a question. You get an answer.
Not a chart. Not a dashboard you have to interpret. An actual answer — with the data behind it, the reasoning that produced it, and a recommendation for what to do next.
"What caused margin compression in Q4?" "Which accounts are most likely to churn in the next 90 days?" "How does our CAC payback compare to our peer group?"
I want to be precise about what is happening here because the distinction matters. This is not a chatbot sitting on top of a database. It is an autonomous agent that lives inside your data environment. Before you ask your first question, it already understands your schema, your KPI definitions, your company context, and how your industry works. It has done its homework.
Under the hood, a single agent handles everything — but it is fast when the question is simple and thorough when the question is complex. Ask for a number and you get it in seconds. Ask why margins compressed and the agent will query your warehouse, run computations, execute time-series forecasts, pull live web research on your competitors, and generate interactive visualizations. Same agent, same interface. It just scales its depth to match the question.
The agent also pulls from everything connected to your account — structured data, uploaded documents like contracts and memos, company context, live market intelligence — and reasons across all of it simultaneously. This is why it can answer questions that blend hard numbers with business context in one shot. "Why is churn spiking and what are competitors doing about it?" is one question, not two.
Every answer comes with a confidence level. Every recommendation has a time horizon. Every insight links back to the exact data that produced it. If you don't trust an answer, you can trace it. That was a non-negotiable design decision from day one.
The old model assumes the user will learn the system, build their own views, and figure out what the data means. I think that assumption is just wrong. It is the reason most organizations still make critical decisions on instinct despite spending millions on analytics infrastructure. KNOWIDEA inverts it. Instead of you going to the data, the intelligence comes to your question.
This is not theoretical. We have been running this in production with enterprise clients across mining, manufacturing, consulting, and financial services — organizations with real complexity and real stakes. One deployment identified over $80M in broker-level revenue leakage that had been invisible in existing dashboards. Not because the data wasn't there. It was. Nobody had asked the right question in the right way, and no system had been capable of chasing the answer across six different tables, benchmarking it against industry norms, and coming back with a prioritized action plan. The agent did that in minutes.
Strategic Reports & Executive Slides
Some questions are too big for a single answer. And sometimes the insight needs to reach people beyond the person who asked — a board, an investor, a leadership team that wasn't in the room.
For these, KNOWIDEA generates two outputs: a full strategic report and a concise slide deck.
The report walks through your question in six stages: descriptive (what happened), benchmarking (how do we compare), diagnostic (why did it happen), predictive (what happens next, modeled across three scenarios), execution (what should we do), and summary (the 5-7 insights that actually matter, each with a confidence level and a deadline).
Every report includes the data sources behind every claim, citations from both internal data and external market intelligence, and a full audit trail. You can trace any number back to its source. This is not optional. If you cannot trace it, we do not ship it.
The slides serve a different purpose — they are built for the room where decisions happen. A CFO looking at portfolio risk gets a different deck than a COO investigating operations, even when both draw from the same underlying analysis. Same intelligence, different lens. You can switch between report and slide view instantly.
How Nova Actually Thinks: The Predictive Insight Engine
This is the part I am most excited to write about.
Most AI-generated reports are summaries. They take your data, compress it into something readable, and hand it back. That is useful. But a summary only tells you what happened. It does not tell you why, what comes next, or what to do about it. The gap between "summary" and "strategic recommendation" is enormous, and closing it is the entire game.
Every output KNOWIDEA produces — whether a quick answer or a 30-page strategic report — is powered by what we call PIE: the Predictive Insight Engine. At the core of PIE is the Decision Intelligence Equation:
Data + Context → Information → Benchmarking → Insight → EV + Risk → Intelligence → Decision
I want to be concrete about what this means, because it is not a marketing slogan. It is the literal sequence the agent's chain of thought follows, every single time.
Here is the backstory. We spent months doing something that felt almost anthropological — we sat with elite strategic advisors. Consultants who have spent careers at McKinsey and BCG. Data scientists who have built analytics functions from scratch. Operators who have made thousand-person hiring decisions based on their read of the numbers. We asked them all the same question: when you start with a raw dataset and end with a recommendation, what are the actual cognitive steps in between?
The answers were surprisingly consistent. Not identical, but convergent. There is a shape to how experts think through data, and it is not "look at the numbers and have an insight." It is a sequence. A discipline. A set of verification habits and instincts that have been honed over years of getting things wrong and learning from it.
We mapped those patterns. Then we distilled them into the agent's chain of thought. The result is PIE.
PIE operates in three phases. Each phase builds on everything before it. No phase can run out of order. No step can skip its predecessor's output. This is strict by design — the sequencing is the entire point.
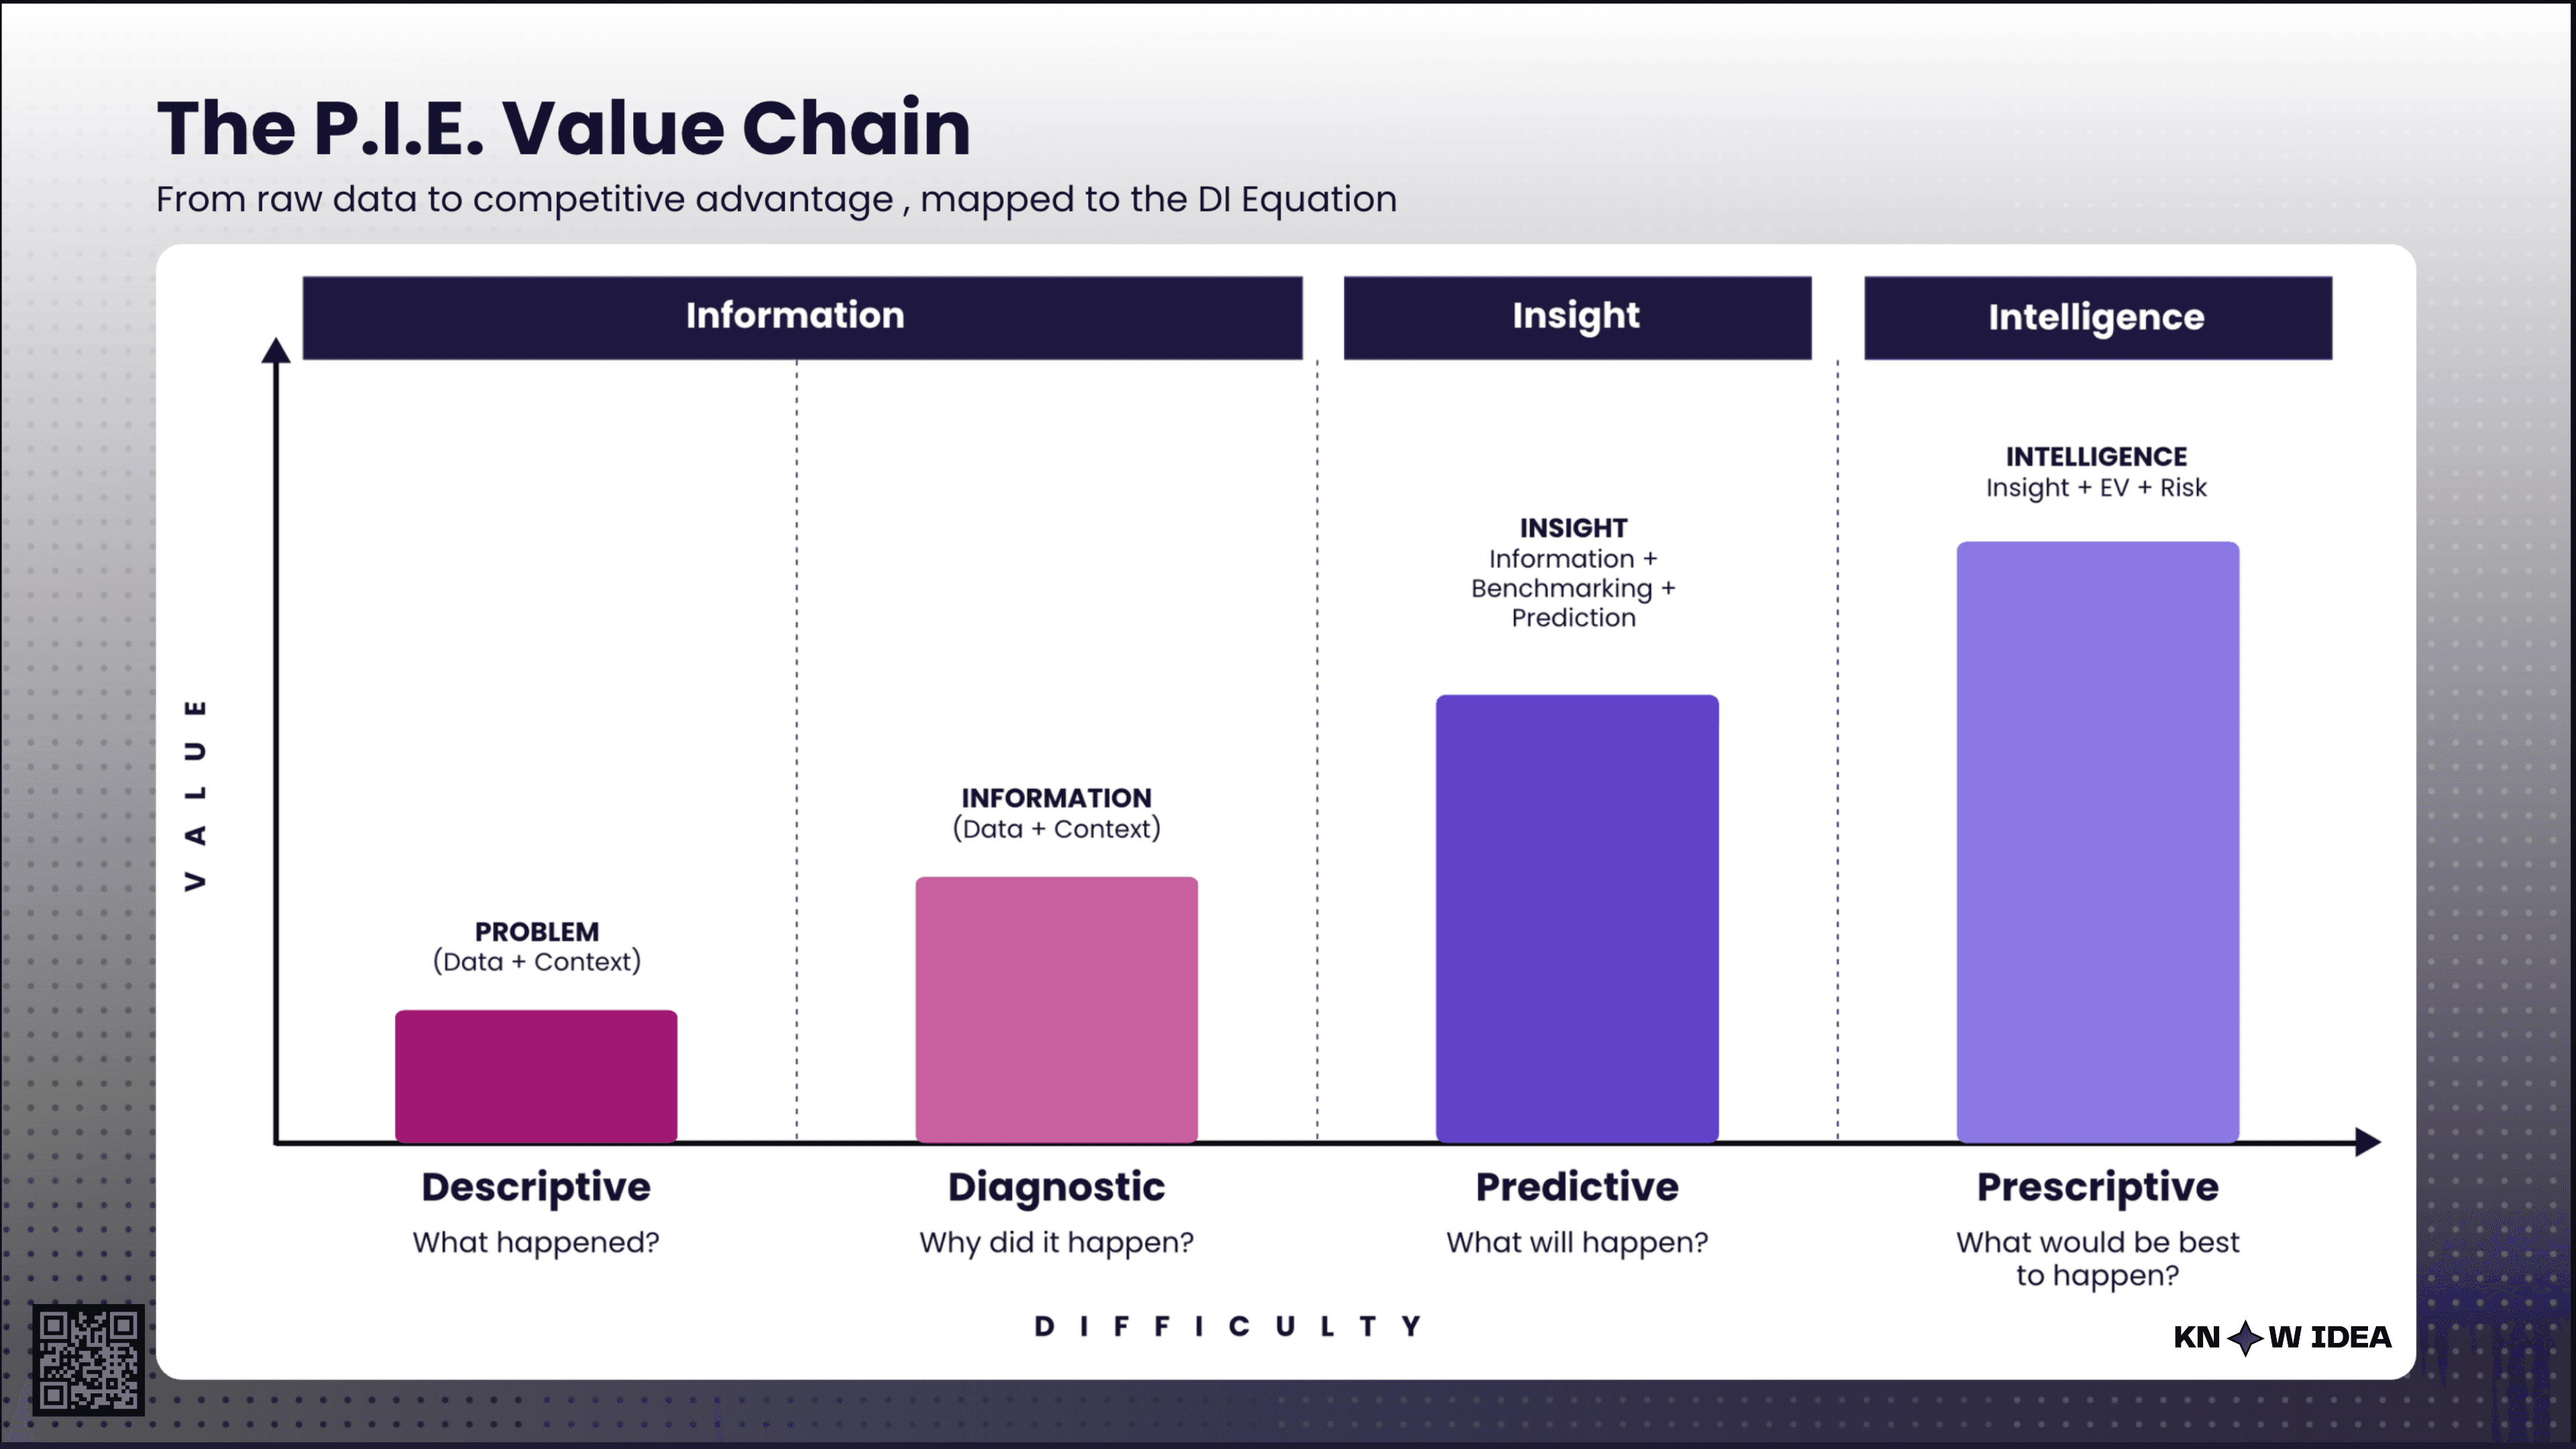
The PIE value chain: how the Predictive Insight Engine moves from raw data to executive-ready decisions across three phases.
Phase 1 — Understand.
Before any analysis happens, the agent builds a complete evidence base. This sounds obvious but it is the step that most AI systems skip entirely, and it is where most analysis goes wrong.
First, the agent reframes your question. Not to change what you asked, but to make it precise — identifying the data domain, the analytical angles worth exploring, and the business decision your question ultimately serves. Think of it as the difference between "why are margins down" and "analyze margin compression across product lines, customer segments, and pricing changes, with the goal of identifying which operational levers the executive team can pull this quarter." Same question. Very different analytical surface area.
Then comes pure retrieval. The agent goes into the data, pulls every relevant metric, explains each one in plain language, and — this is the part I care about most — cites the exact source. Not "from the data." Which table. Which column. Which filter. Which calculation method. We enforce this because it is where methodology errors hide. I have seen analyses where a "termination rate" was calculated by counting transactions instead of counting unique accounts. The numbers looked plausible. They were wrong. The source citation catches this before it cascades.
From there, the agent distills the evidence into categorized KPIs — separating internal operational metrics from industry-comparable ones. This matters because the next phase needs to know what can be benchmarked externally and what cannot. Trying to benchmark a proprietary internal metric against an industry average is a waste of time, and the agent should not do it.
Phase 2 — Benchmark.
Numbers in isolation are almost meaningless. "Our churn is 8%" — is that good? Bad? Alarming? You literally cannot tell without context.
The agent provides two kinds of context. First, it compares every KPI against the company's own prior period — flagging what improved, what deteriorated, what stayed flat. This is where you catch trends. Then it positions those same metrics against industry peers and market averages, producing a scorecard with risk levels.
Finally, it builds a SWOT analysis. But not the kind you have seen in a hundred strategy decks — the vague kind with bullets like "strong brand" and "increasing competition." Every bullet in our SWOT must reference a specific data point from the analysis. If the agent cannot cite a number, it does not make the claim. That single constraint eliminates probably 80% of the generic filler that makes most SWOT analyses useless.
This phase is also where the agent surfaces the most dangerous kind of pattern — the headline metric that looks better while the structural health underneath is quietly falling apart. Your outflow ratio improved 12 points. Great. But the brokers who are still net-negative are now 2.4x more destructive per broker than last year. SIPs are dying faster. Dormant brokers are growing. The headline got better. The foundation got worse. That kind of second-order nuance is exactly what separates an insight from a number, and it is exactly what gets lost when you skip the benchmarking step.
Phase 3 — Knowledge.
This is where the system shifts from measurement to meaning. From "what is true" to "what should you do about it."
Using everything accumulated in the first two phases, the agent generates insights tailored to a specific executive persona. This is not cosmetic. The same data point becomes a fundamentally different insight depending on who receives it. "Dormant brokers grew 17.6% year-over-year" means one thing to a CEO (your distribution network is silently contracting, here is the AUM at risk), something different to a COO (three regional centres account for 43% of dormancy, here is where to intervene), and something different again to a Head of Data (dormancy follows a 90-day decay pattern, here is where to put the tripwire). Same number. Three different insights. Three different actions.
The agent then converts those insights into strategies mapped to established decision-making frameworks — Eisenhower, McKinsey 3 Horizons, Porter's Five Forces. But here is the key: the agent chooses the framework. A retention problem maps naturally to Eisenhower. Market expansion maps to 3 Horizons. Competitive positioning maps to Porter's. Forcing every problem into the same framework is a common failure mode; we let the agent match the framework to the problem and explain why it chose what it chose. The client gets a transferable mental model, not just a table.
Every strategy gets scored on Expected Value versus Risk — decomposed into probability of success, magnitude of impact, implementation difficulty, downside exposure, and time-to-value. This is where the ranking often disagrees with the urgency classification, and that tension is the point. A strategy can be "urgent and important" but expensive (low EV/Risk ratio). Another can feel minor but be essentially free (high ratio). The CEO needs to see both views.
The top strategies then get modeled across three scenarios — bull, base, and bear. Every projection must trace back to a data point from the earlier phases. No unsupported estimates. This is where language models hallucinate the hardest, and we treat it as a strict constraint: if the agent cannot show where a number came from, the number does not appear in the output.
The final synthesis follows a specific narrative structure — current state, segmentation, benchmarking context, root cause, financial impact of inaction, recommended action — in that order, because each element builds credibility for the next. We did not invent this order. We observed it. It is how the best advisors we studied actually present a recommendation. By the time you reach "here is what to do," you have already seen the evidence, the context, the why, and the cost of doing nothing. The recommendation lands because the logic chain is complete.
One thing I want to emphasize: PIE runs sequentially, end to end. Every step receives the full accumulated context of everything before it. Every number in the final output traces back through the chain to the exact data query that produced it. If a CEO challenges a finding, the answer is never "the AI said so." It is a clear path back to the source, through every phase, to the specific table and column and calculation.
That is what PIE is. Not a model generating plausible text about your business. A Predictive Insight Engine that reasons through the same intellectual process a world-class advisory team would use — except it runs in minutes, not weeks. It never skips a step. And it shows all of its work.
Live Dashboards
V5.0 still supports dashboards — but you build them by talking.
Type "show me revenue by account manager, last four quarters" into the chat. The agent picks the right chart type, generates a live preview, lets you confirm, and pins it to your canvas. Charts, tables, KPI cards, filters — all work this way.
Once pinned, widgets stay connected to your data and update in real time. You can modify them through follow-up conversation. "Break that down by region." "Add a trend line." "Actually make that a table." It just works.
I think the manual approach — learn a tool, drag boxes, wire up data sources, configure filters — was a reasonable design for 2010. It is not reasonable now. If you can describe what you want to see, you should be able to see it. And because the agent already understands your data, the visualizations it generates are often more precise than what you would build manually (it does not forget to apply the right filters or pick the wrong aggregation level, which, if we are being honest, happens more than anyone likes to admit).
Data & Market Intelligence
KNOWIDEA connects to your data wherever it lives — structured tables, uploaded documents (PDFs, contracts, memos), external connectors — all surfaced through a single explorer.
Market Intelligence runs in the background. KNOWIDEA tracks competitive moves, industry signals, and market shifts tied to your business. When you ask Nova about competitive positioning, it draws on live market data — not a snapshot from last quarter. This matters more than people think. I have seen analyses that were directionally correct based on the data but completely wrong because they missed a competitor move that happened two weeks ago. The data was right. The answer was wrong. Context was the gap.
The broader point is this: shallow insights almost always trace back to incomplete data. If a system connects to a database but not to the business — the contracts, the memos, the market, the context — it will produce analyses that are technically correct and strategically useless. V5.0 treats all of these as equal inputs. The agent reasons across structured and unstructured data simultaneously, which is why it can answer questions that blend hard numbers with qualitative context in a single response.
Your job is to make decisions. Not to manage data pipelines. The data layer should be invisible, and in V5.0, it is.
Why this matters
Here is the thing that has been bothering me for years. Every organization I have worked with sits on more data than it can act on. The bottleneck was never access. It was never storage. It was never compute. The bottleneck was always the same: the ability to turn information into a decision at the speed the business actually needs.
The old model — collect data, build reports, wait for a human to interpret, schedule a meeting, debate the interpretation, eventually act — was built for a time when computing was expensive and human analysis was cheap. That era ended. The scarce resource now is not data or compute. It is decision quality. V5.0 is built for that shift.
This is not an incremental improvement on existing tools. It is, I believe, a genuinely new category — agentic predictive intelligence that reasons autonomously, forecasts outcomes, and delivers recommendations ready for the boardroom. We did not set out to build a better version of what exists. We set out to build what should exist.
What comes next
V5.0 is live today. Nova and the PIE framework are available now. Strategic reports and executive slides are rolling out across all enterprise accounts this quarter.
Two things we are building next.
Explainability and verifiability. Right now, every output traces back to its source data. That is table stakes. What we want is full reasoning transparency — the ability to see not just what the agent concluded, but every decision it made along the way. Why it chose one framework over another. Why it flagged a metric as high-risk. Why it weighted a bear-case scenario at 25% and not 15%. The goal is a system where you can audit the thinking, not just the output. If we are asking executives to act on these recommendations, the reasoning has to be as inspectable as the data.
Multi-agent collaboration. Today, a single agent runs the full PIE pipeline end to end. That works, and it works well. But some problems are bigger than one agent should handle alone. We are building toward a system where specialized agents — a data analyst, a market researcher, a strategy advisor, a financial modeler — can collaborate on the same question, each contributing their expertise, challenging each other's assumptions, and converging on a recommendation that is stronger than any single agent could produce. Think of it less like one consultant and more like a war room.
I have more I want to write about each of these. But this post is already long, and the system is live, and I would rather you tried it than read about it.
Try it
Here is what I would suggest. Think of the one question you have been meaning to ask your data — the one that would normally take your team a week and three meetings to answer. The one where you already suspect what the answer is but nobody has been able to confirm it with numbers.
Ask Nova that question. Watch it reason through it. Read the sources. Check the math. See if the recommendation surprises you.
If it does what I think it will do, you will understand why we built this the way we did. And if it doesn't, I want to know — that is how the system gets better.
Book a demo at knowidea.dev, or reach out directly. We are a small team that builds fast and talks to every client personally. That is not a phase. That is how we intend to operate.
Welcome to V5.0.
\- Brian Li, CTO & Co-Founder